
STRATEGY IDEAS
fidelity active trader pro
Strategy Ideas is an options backtesting tool designed to see if a selected multi-leg option strategy has been profitable in the past under given conditions. The idea is to take that information, and apply to future conditions, to see if it's a good strategy to use going forward.
We created a tool that not only didn't exist in the marketplace before we built it, but changes the way users think about options and how to trade them. It helps users make better trading decisions, to secure their financial future.
The challenge in this project was how to build a simple interface that requires extremely complicated inputs, and gives back extremely complicated outputs. Using smart defaults, a layered chart, and full sentence explanations rather than just labels and values, we solved a lot of the complexity issues.

CHANGING THE USERS MENTAL MODEL
Backtesting options didn't exist until we built it. Option traders didn't even realize this kind of analysis was possible, because options aren't long term investments. They come into existence one month, and are gone the next, and so how can you trace how many different contracts did over time? We designed the way, and our most advanced, and profitable, users found a lot of value.
SMART DEFAULTS
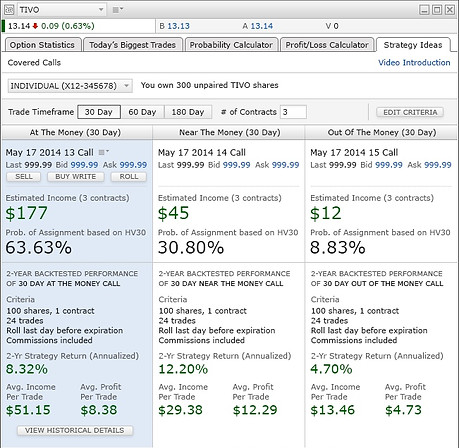
There are potentially hundreds of combinations of inputs. By using smart defaults, we can more easily engage users and show some of the more interesting outputs on the first page.
Here, we're setting timeframe and number of contracts, and then spelling out the rest of our assumptions in the vertical sections. We've limited results to the three most common, as showing returns was more important than presenting the dozens of possible results.

LAYERED CHARTS
Data points weren't compelling enough to help change user's mental model. So we designed a chart with the option contract layered on top of the stock price. This shows how each contract in the strategy did, and can give users a visual sense of whether the strategy can work for them in current market conditions. Along with the tool tip showing the breakdown for each contract in the strategy, this was one of the most popular parts of the tool.